GlobalRetail Data Analysis
End-to-end retail analytics on 50,000 orders including time-series analysis, profitability analysis, customer segmentation (RFM), returns analysis, and predictive modeling.
Simulation Note: This project uses a synthetic/sample dataset. Financial impact, savings, ROI, and SLA-cost estimates are modeled scenarios for analytical demonstration and do not represent actual NTC financial figures.
Modeled Estimate (synthetic data)
Analysis Charts
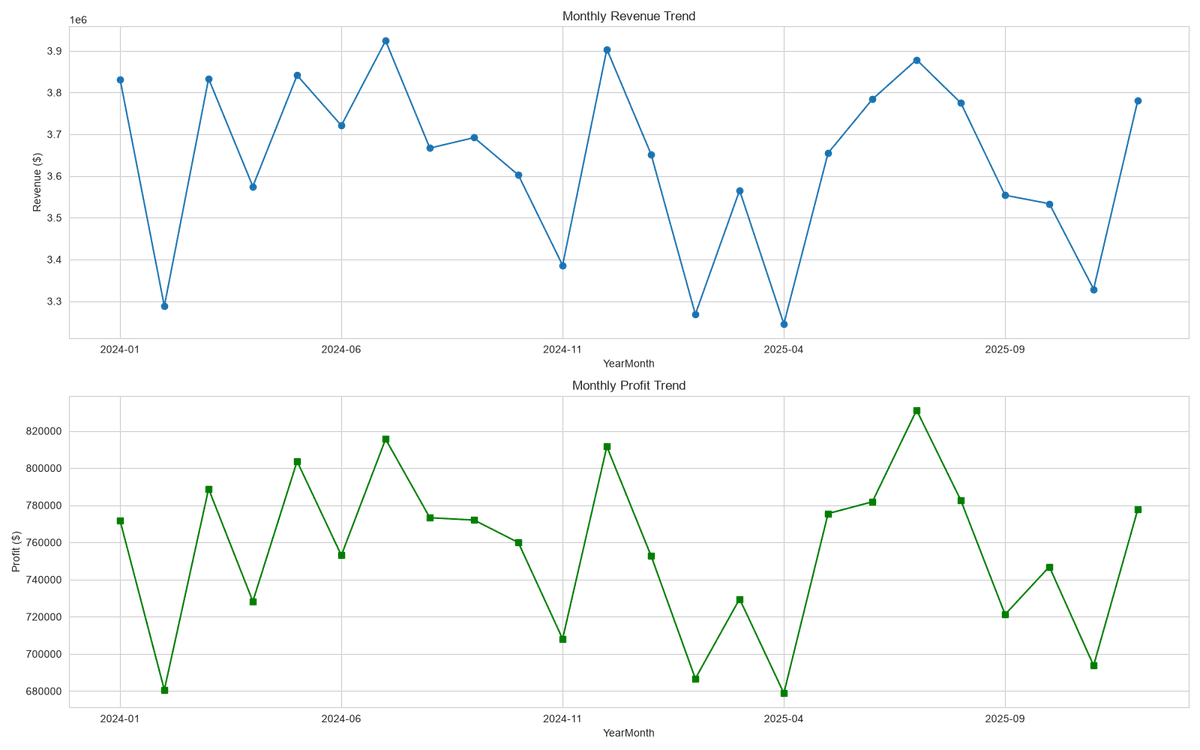
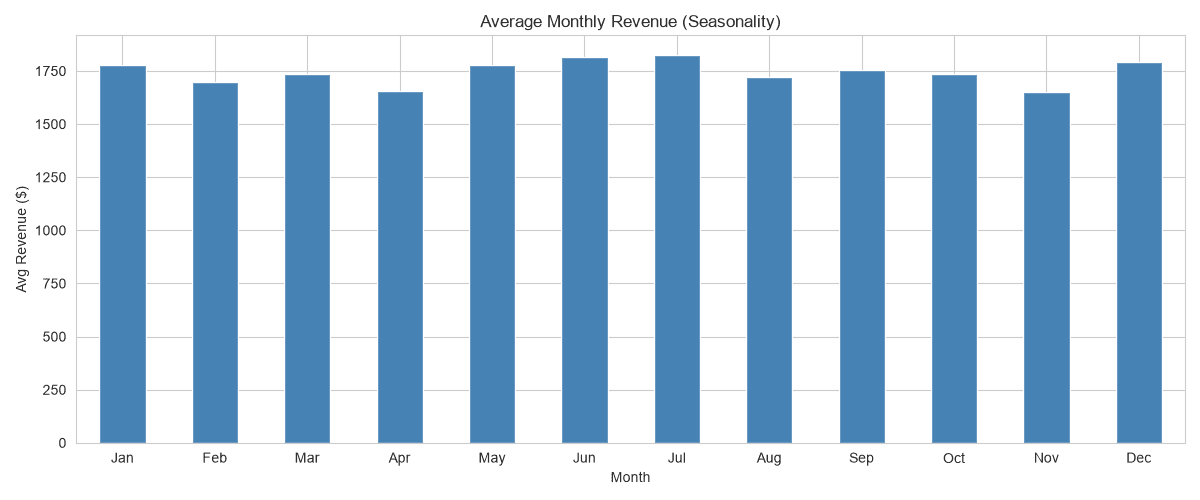
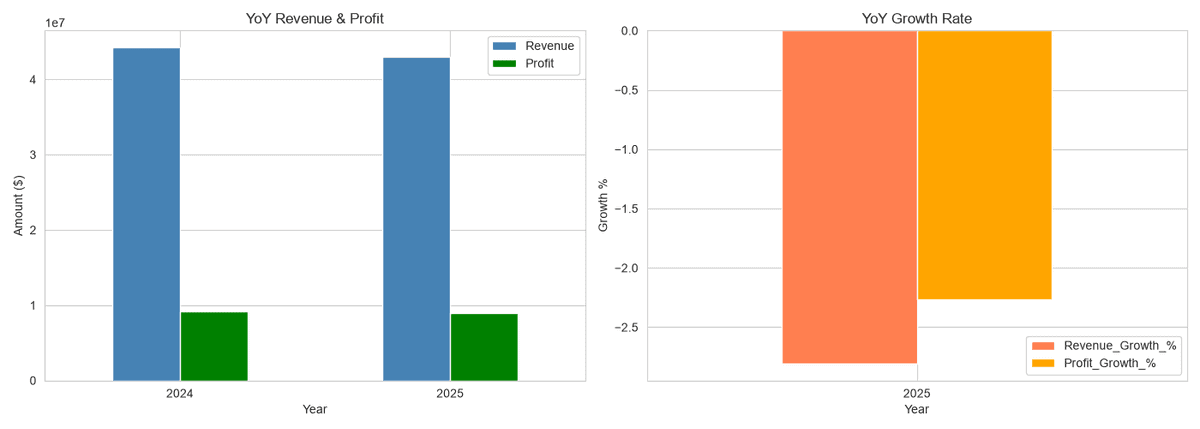
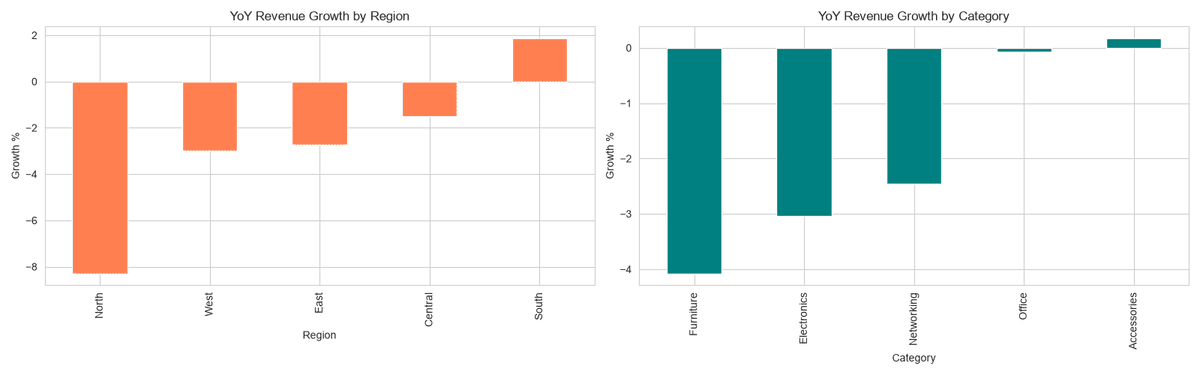
Time-Series Analysis
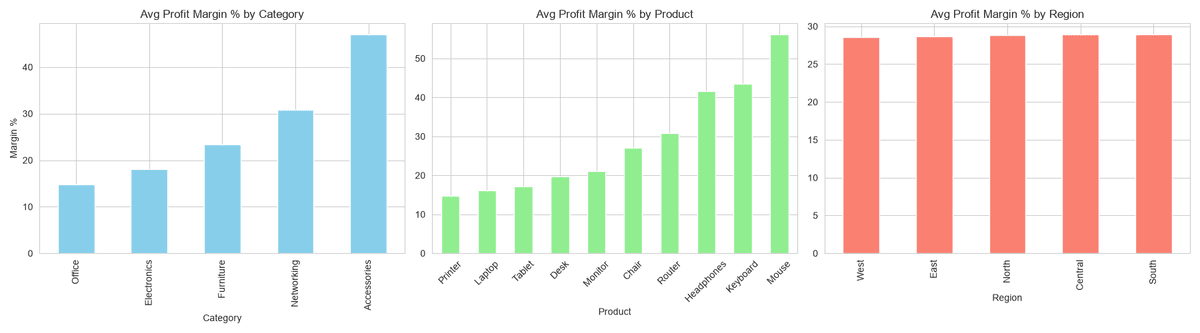
Profitability Analysis
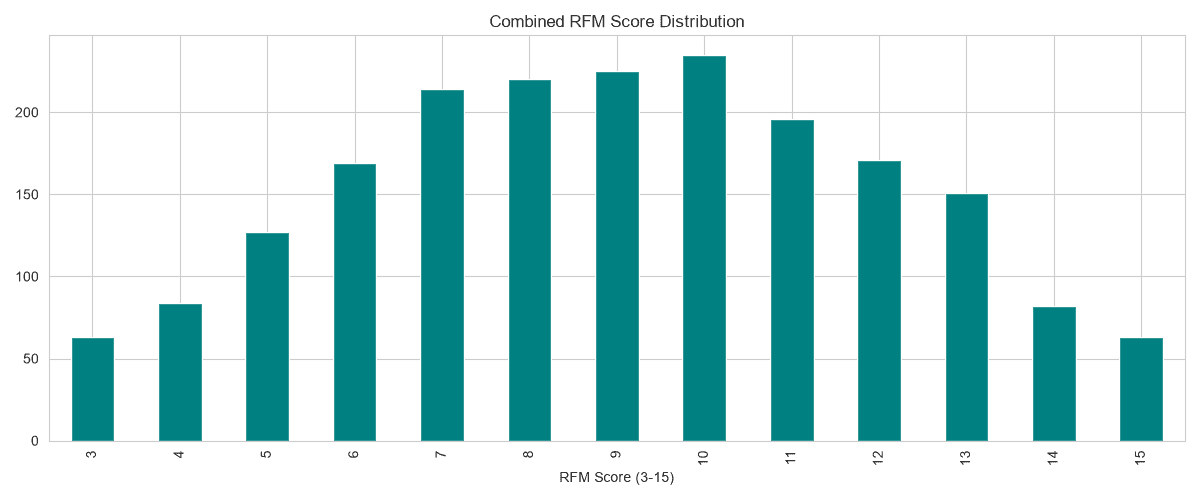
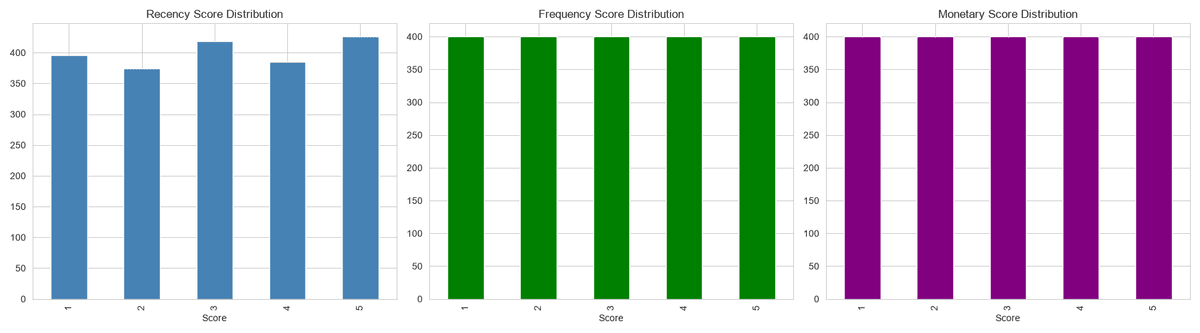
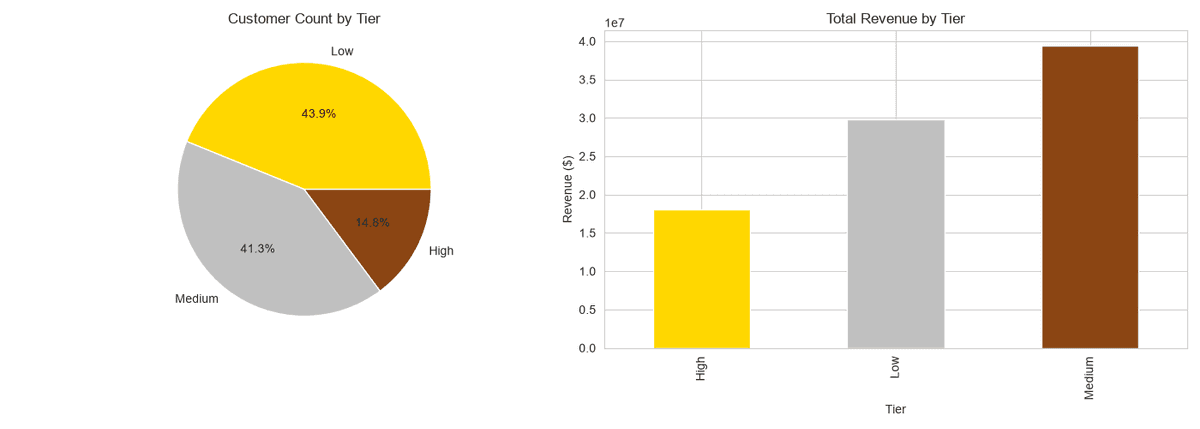
Customer Segmentation
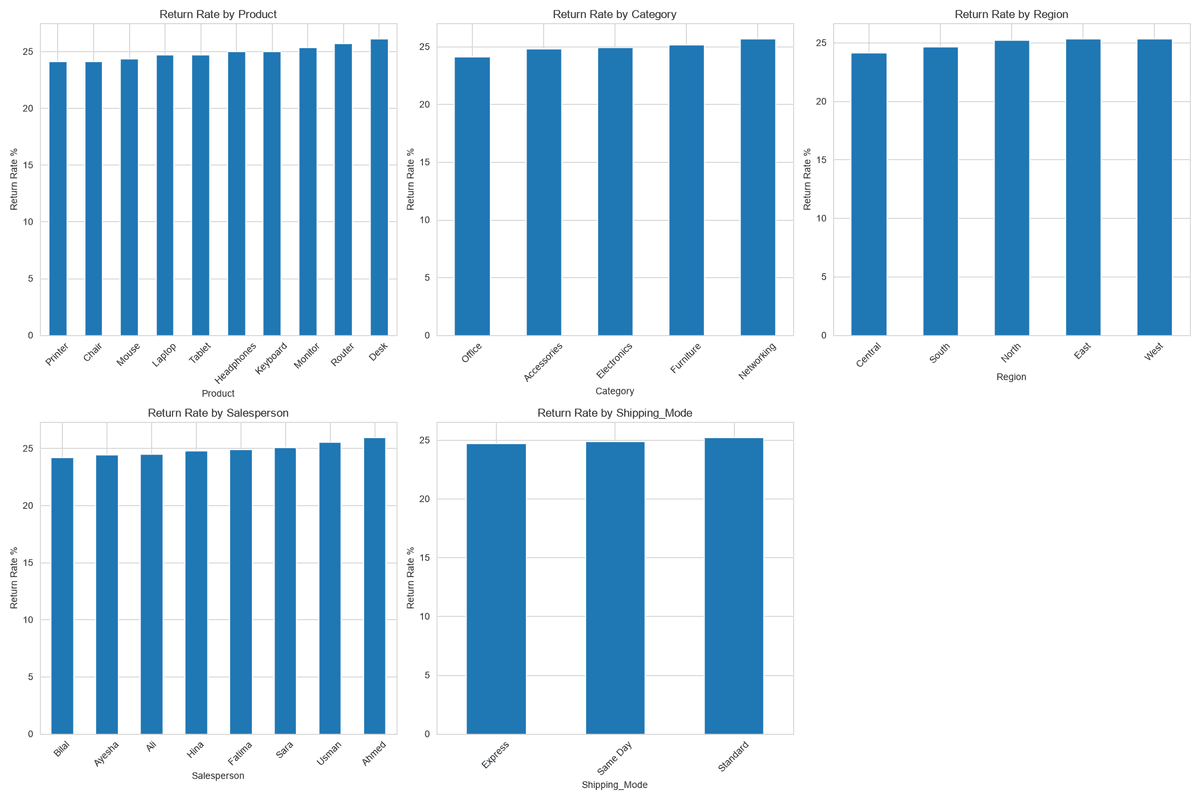
Returns & Shipping Analysis
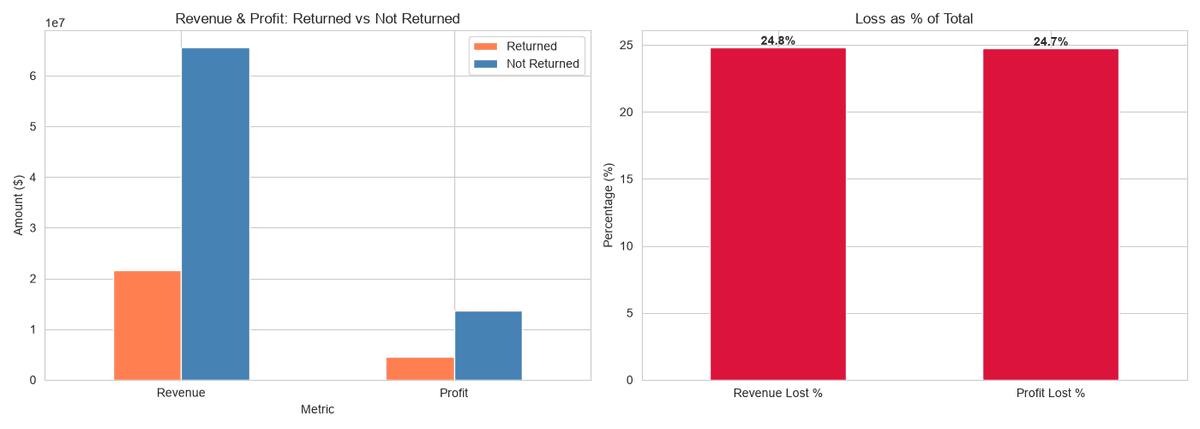
Salesperson & Advanced Analysis
Business Problem
A global retailer was struggling with declining profitability despite growing revenue, high return rates eating into margins.
Methodology
Data Collection
Data Cleaning
Exploratory Data Analysis
SQL Analysis
Visualization
Insights
Recommendations
Key Insights
Revenue declined 2.8% YoY — need for growth strategy reversal
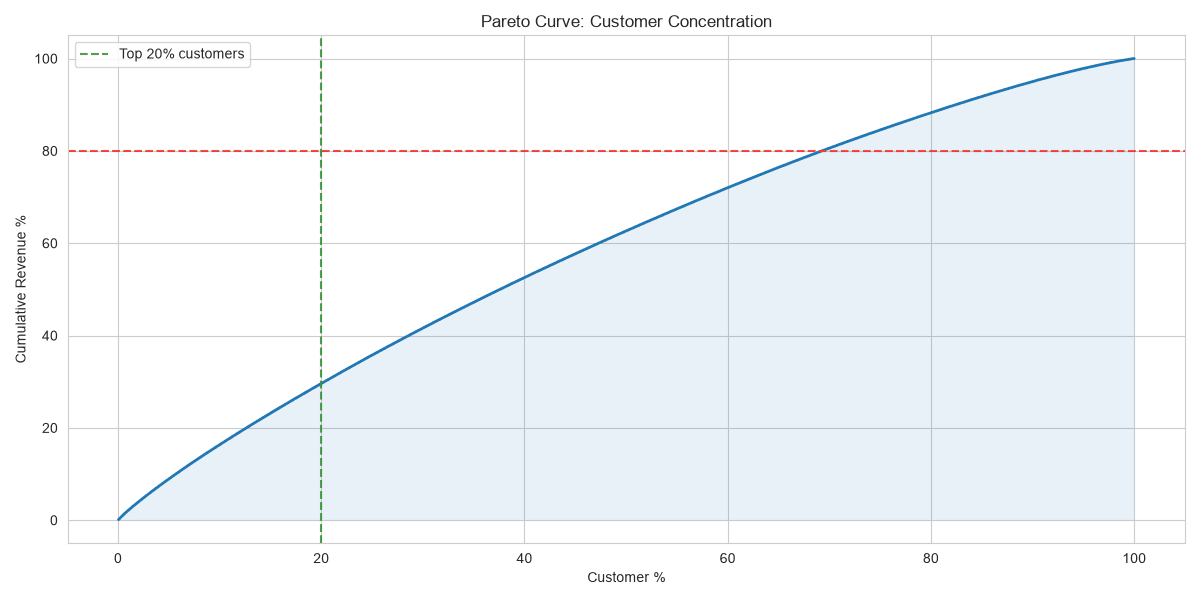
Top 20% of customers generate ~29.5% of total revenue
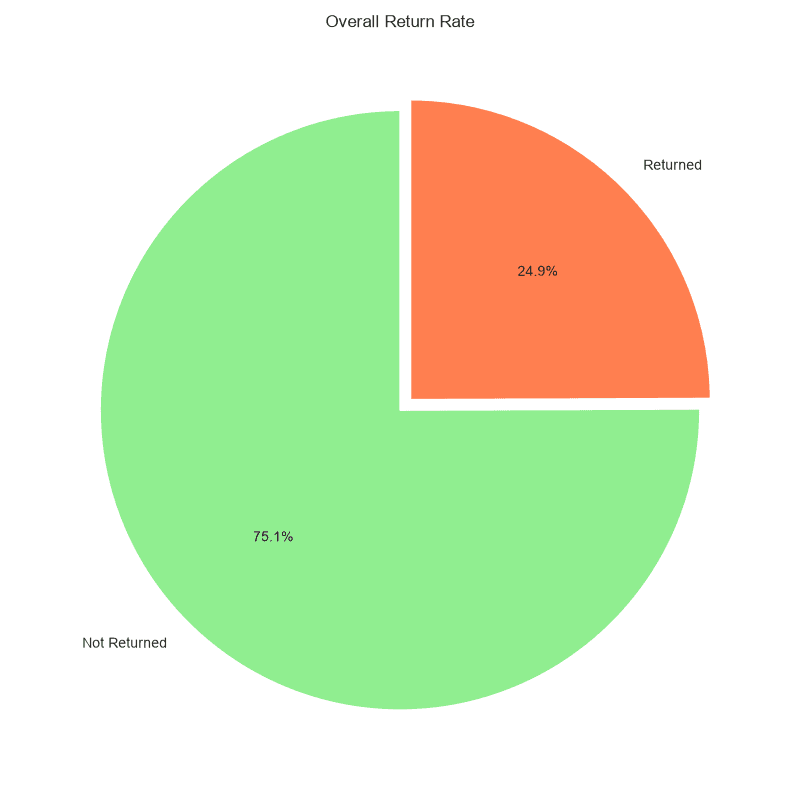
Return rate of 24.94% resulting in $4.5M in lost profit
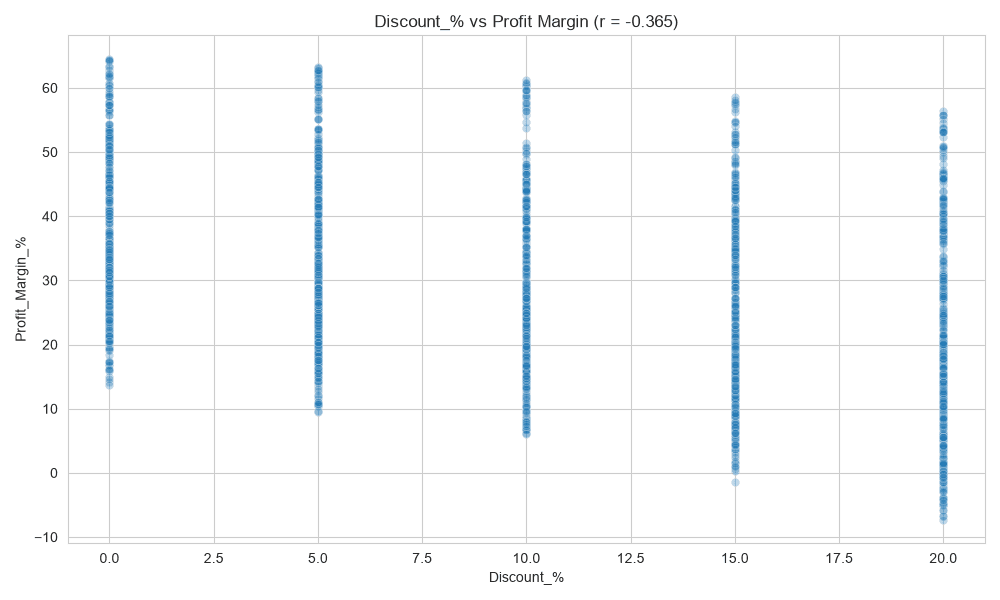
Discount-profit margin correlation of -0.365 — higher discounts hurt margins
RFM segmentation created 3 customer tiers for targeted marketing
Business Recommendations
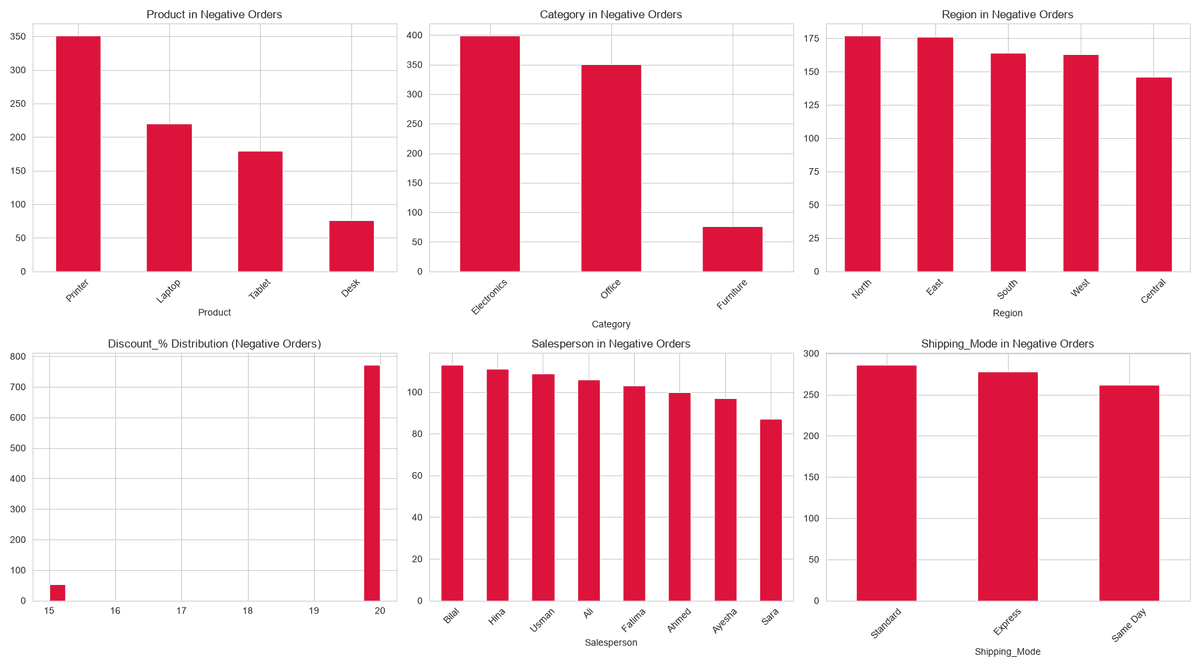
Modeled Estimate (synthetic data)Cap discounts at ~20% for margin-sensitive categories to protect profitability.
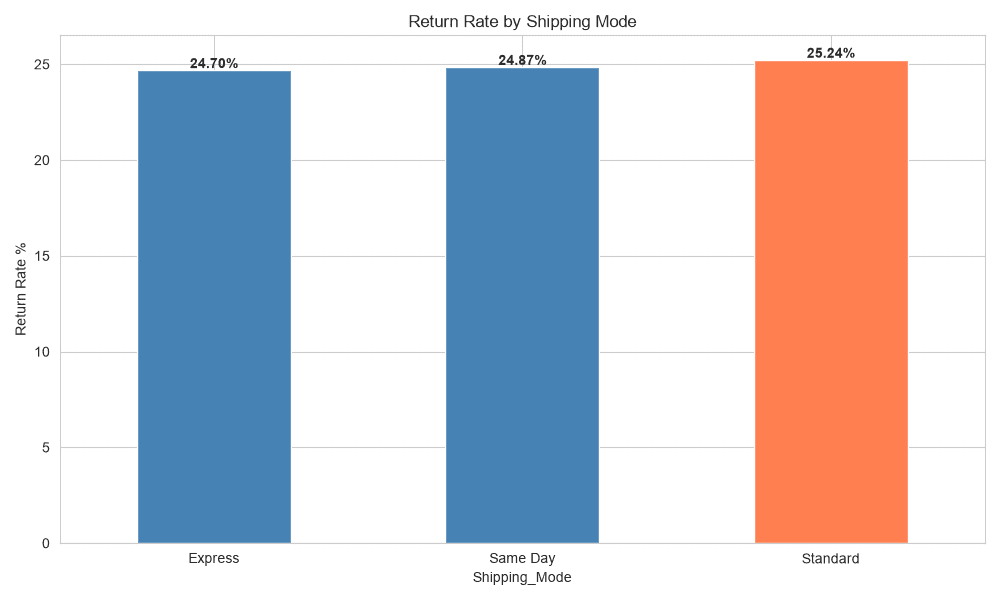
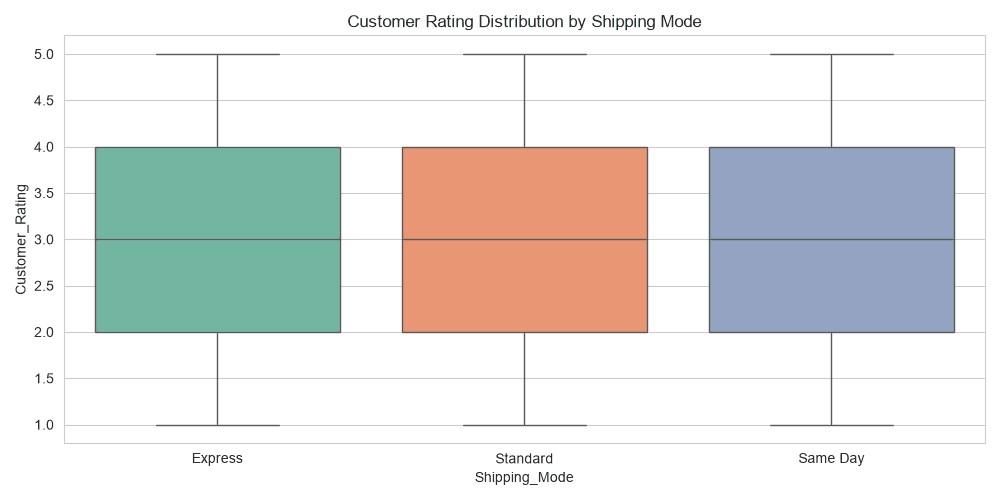
Review Same Day shipping returns and consider restricting it to high-value repeat customers or adding a restocking fee.
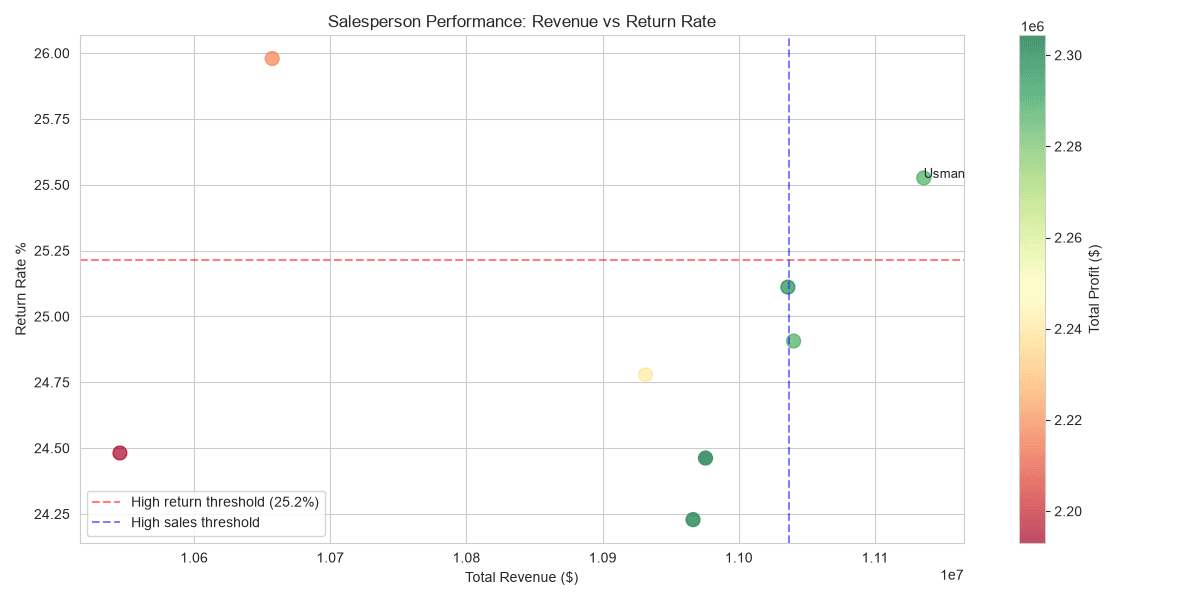
Study top salesperson strategies and convert them into training material for underperformers.
Use the RFM tiers to run targeted retention campaigns on High-value and At-risk segments.
Technical Highlights
Python
- ▸Pandas data wrangling
- ▸Time-series analysis
- ▸RFM customer segmentation
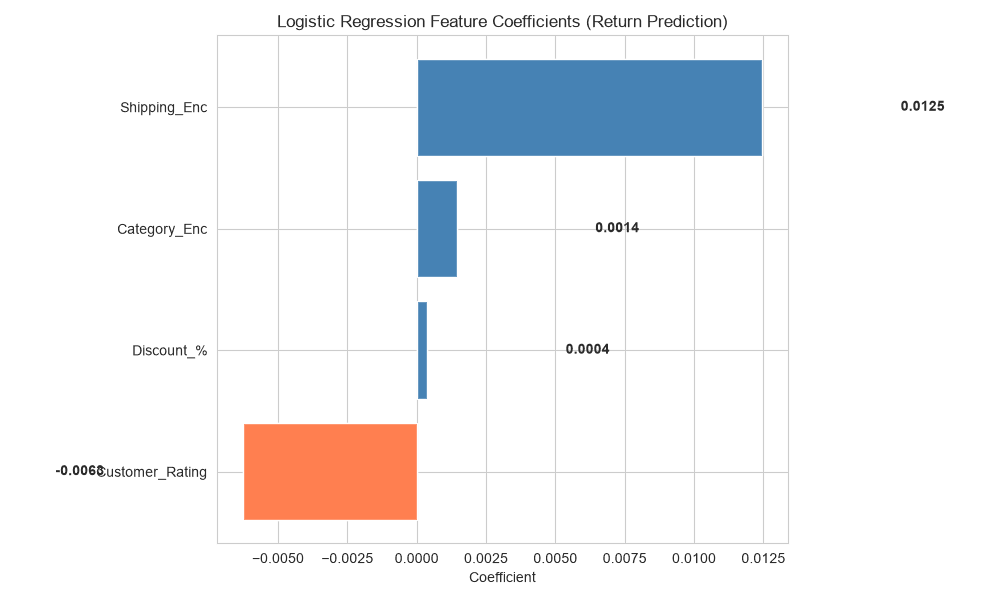
- ▸Logistic regression modeling
Analysis
- ▸YoY growth analysis
- ▸Profitability decomposition
- ▸Return rate analysis
- ▸Pareto (80/20) customer analysis
Visualization
- ▸22+ charts generated
- ▸Interactive dashboards
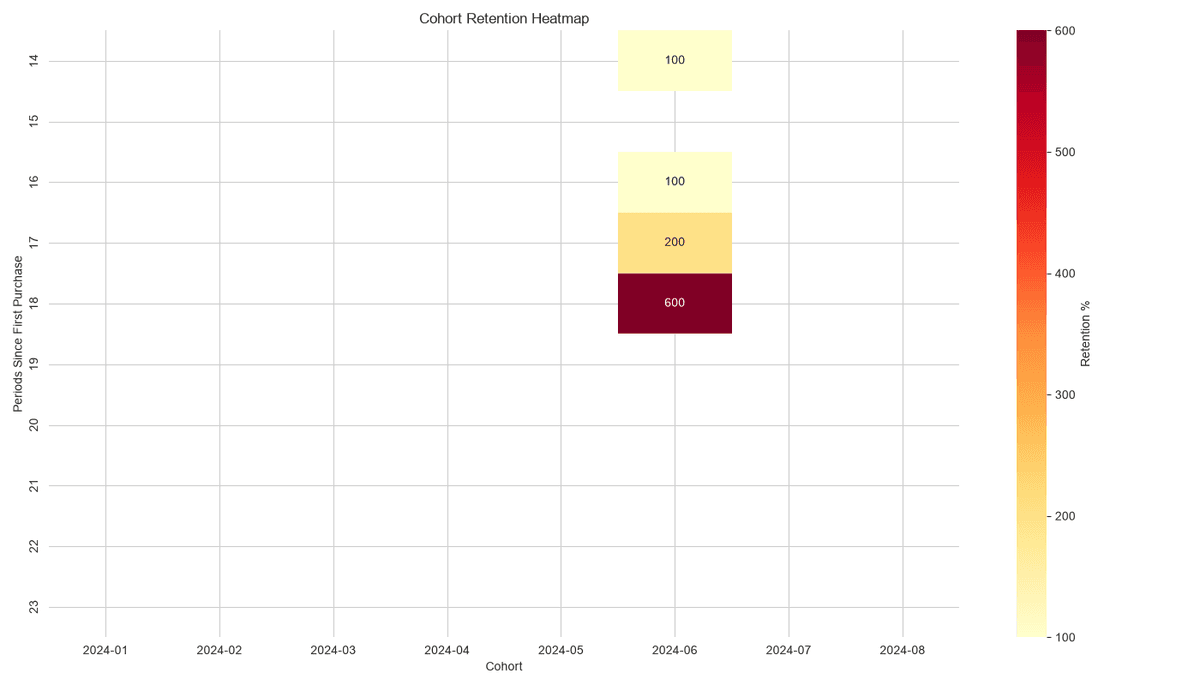
- ▸Cohort & RFM heatmaps
- ▸Presentation-ready slides
Dataset
50,000 orders from 2024-2025, spanning 2,000 customers, $87.3M revenue, across multiple regions and product categories.
Project Outcome
Modeled Estimate (synthetic data)Identified estimated $2M+ profit recovery opportunity across 50K orders by analyzing return patterns, customer segments, and discount impact on margins.