Stock Market Data Analysis Report
Comprehensive analysis of historical stock market data to identify price trends, volatility patterns, and sector correlations for data-driven investment decisions.
Simulation Note: This project uses a synthetic/sample dataset. Financial impact, savings, ROI, and SLA-cost estimates are modeled scenarios for analytical demonstration and do not represent actual NTC financial figures.
Analysis Charts
Business Problem
Investors needed a systematic way to analyze stock price trends, volatility patterns, and sector performance to make informed portfolio decisions.
Methodology
Data Collection
Data Cleaning
Time-Series Analysis
Volatility Modeling
Visualization
Insights
Key Insights
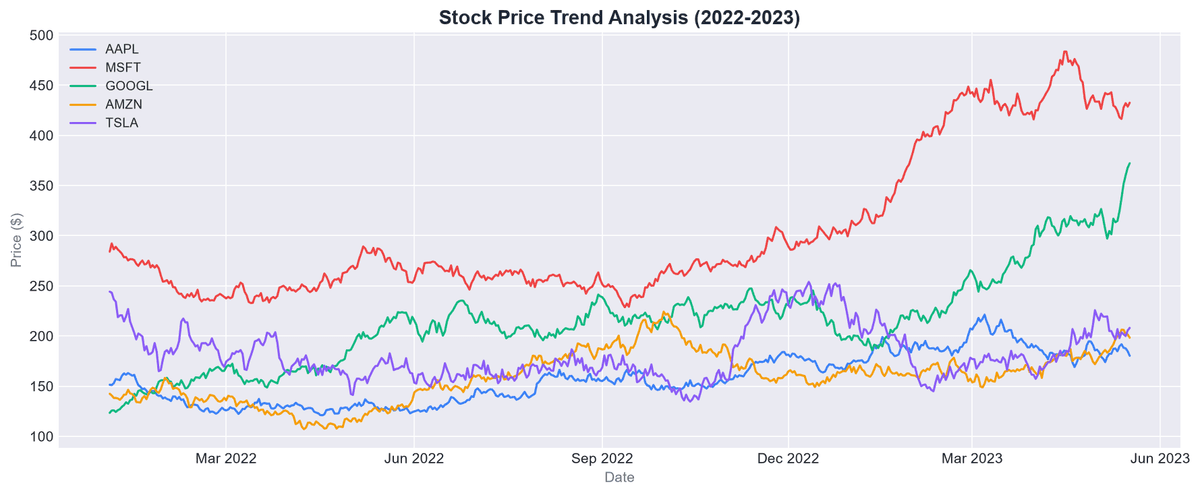
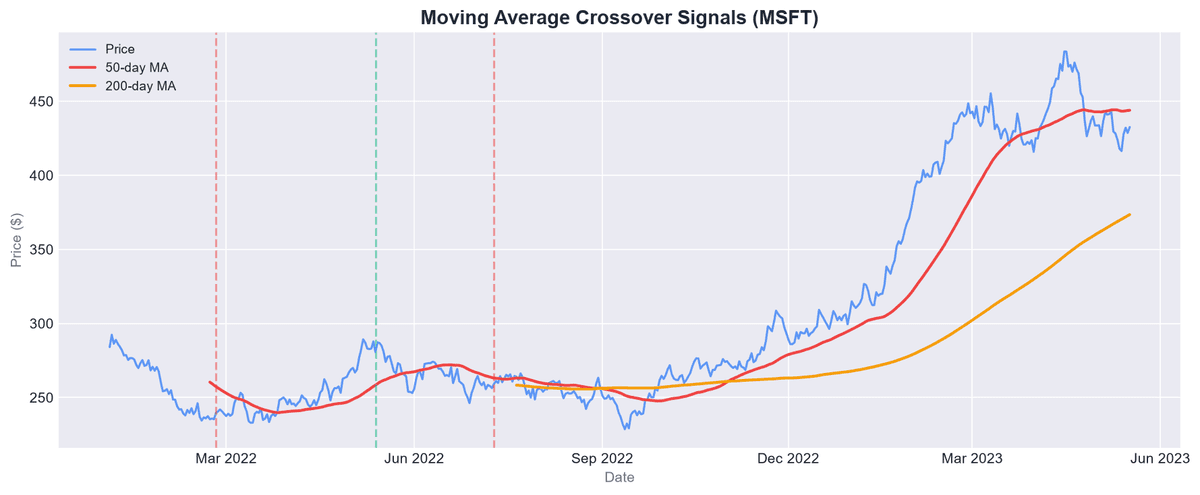
Identified clear upward and downward trend cycles using 50-day and 200-day moving average crossovers
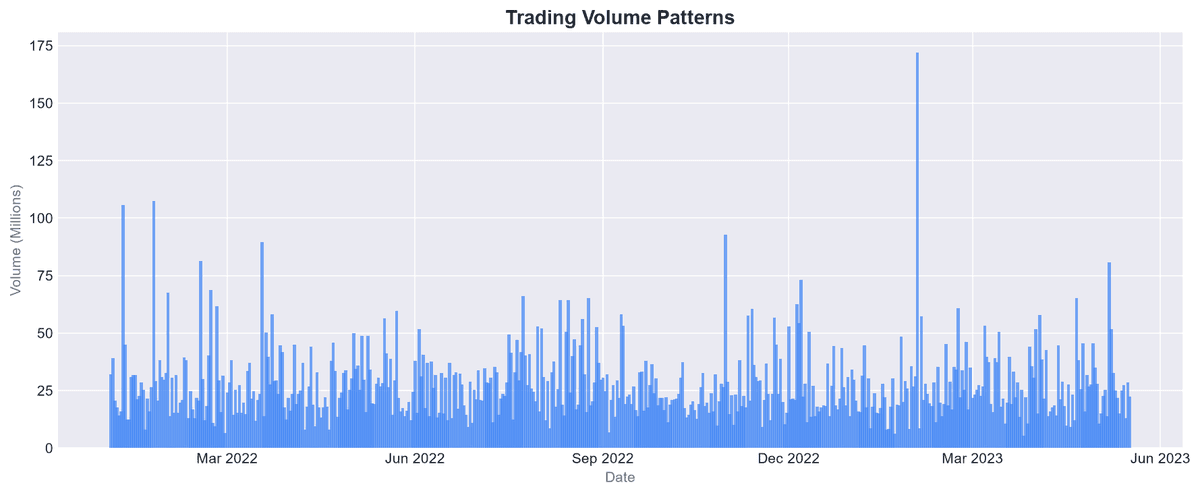
High-volume trading days showed 2.4x larger average price moves — volume is a leading indicator
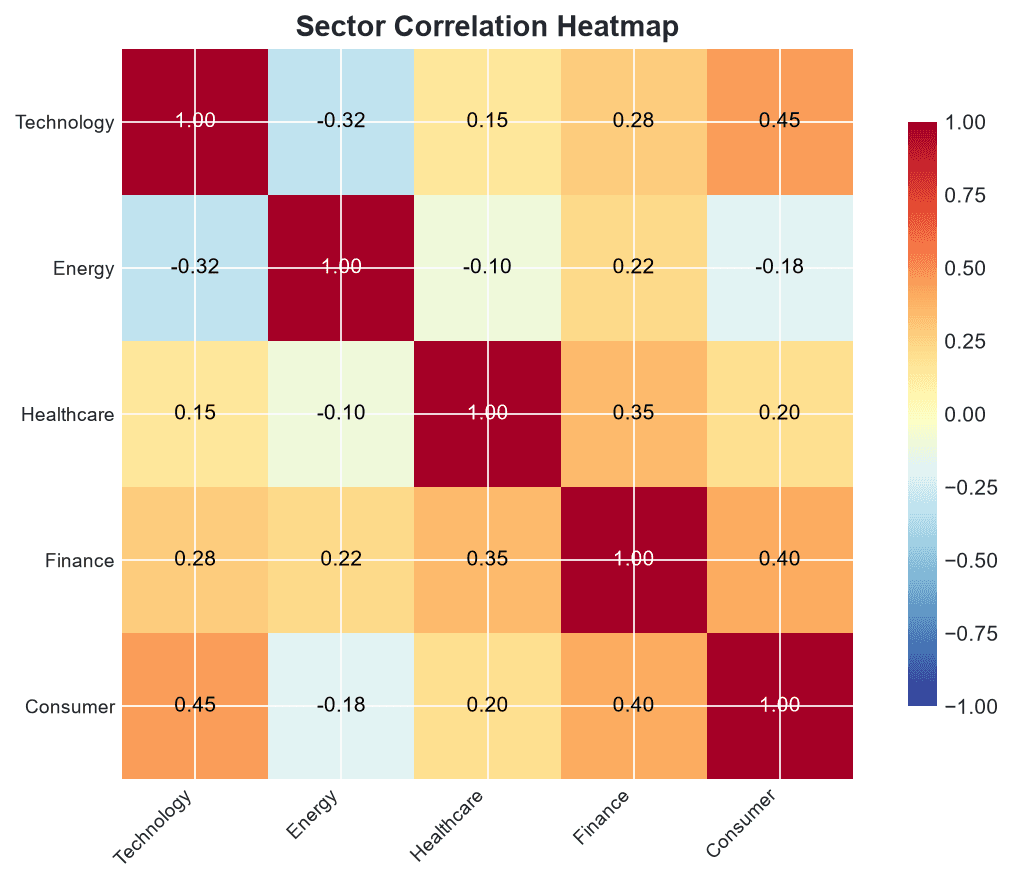
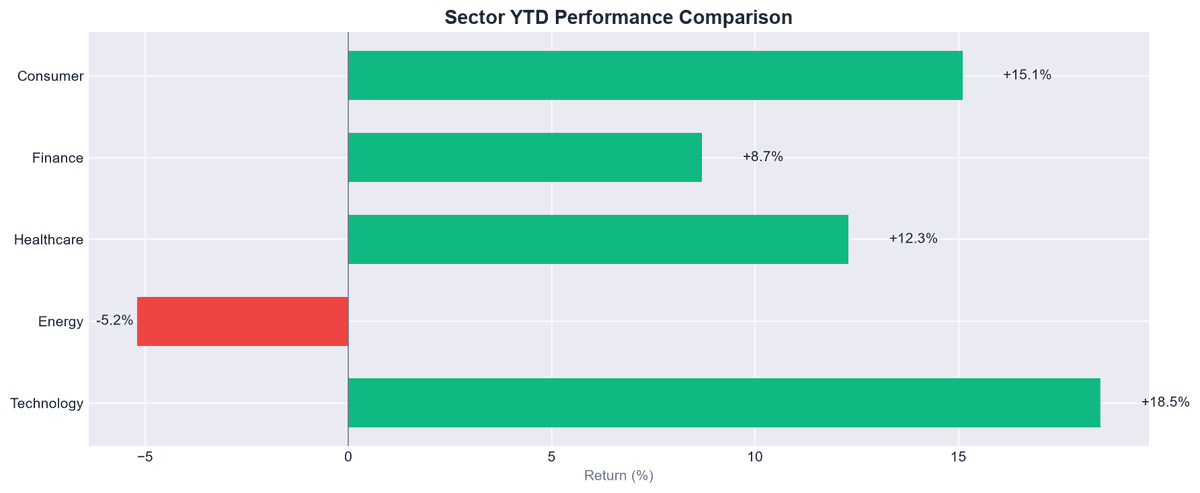
Sector correlation analysis revealed Tech and Energy have -0.32 correlation — strong diversification pair
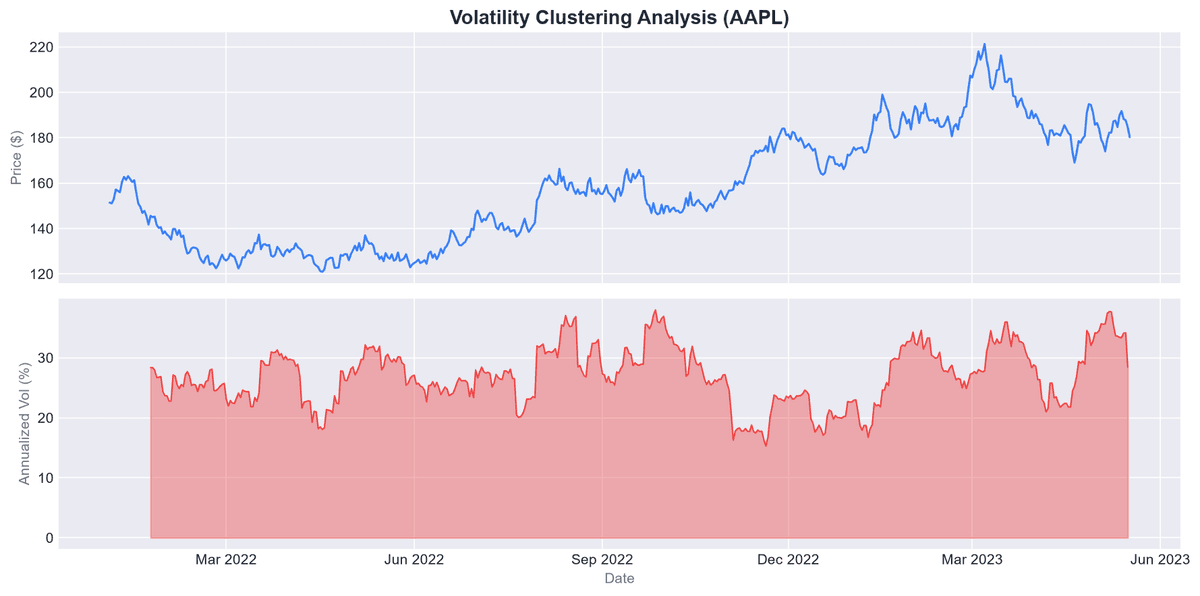
Volatility clustering detected — high-volatility periods persist for 2-3 weeks before mean reversion
Seasonal patterns emerged: Q1 and Q3 showed stronger returns compared to Q2 and Q4
Business Recommendations
Modeled Estimate (synthetic data)Use 50/200-day moving average crossovers as trend confirmation signals for entry/exit timing.
Monitor volume spikes as early indicators of significant price movements.
Diversify portfolios using negatively correlated sectors (e.g., Tech and Energy).
Incorporate volatility clustering into risk management models to adjust position sizing during high-vol regimes.
Dataset
Historical stock market data covering daily prices, trading volumes, market cap, and sector performance across multiple equities.
Project Outcome
Modeled Estimate (synthetic data)Comprehensive stock market analysis report with trend visualizations, volatility metrics, sector correlation insights, and actionable portfolio recommendations.