TechMart Sales Analysis
Comprehensive exploratory data analysis on 5,000 sales records to identify growth opportunities, regional disparities, and discount strategy optimization.
Simulation Note: This project uses a synthetic/sample dataset. Financial impact, savings, ROI, and SLA-cost estimates are modeled scenarios for analytical demonstration and do not represent actual NTC financial figures.
Analysis Charts
Business Problem
A mid-sized electronics retailer was facing declining sales and needed to understand patterns across regions, products, and time periods.
Methodology
Data Collection
Data Cleaning
Exploratory Data Analysis
Visualization
Insights
Recommendations
Key Insights
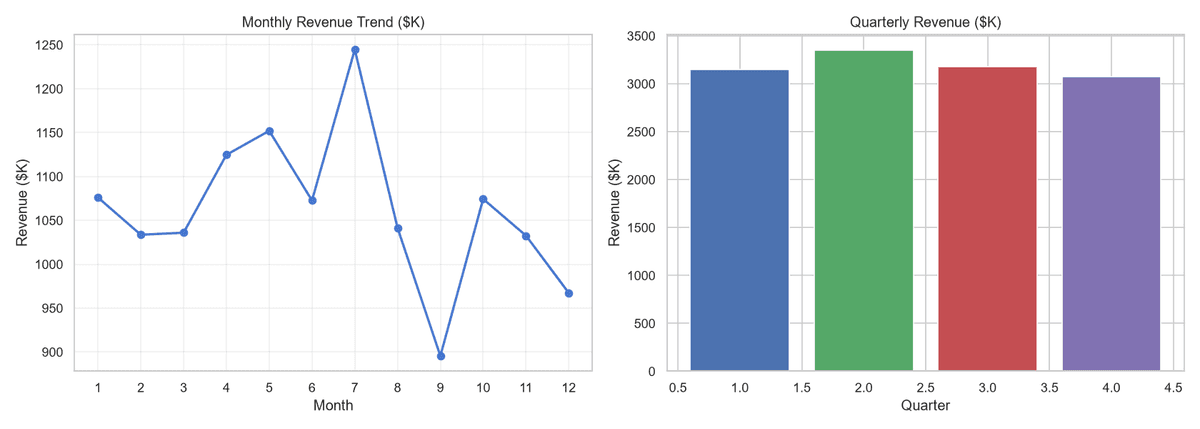
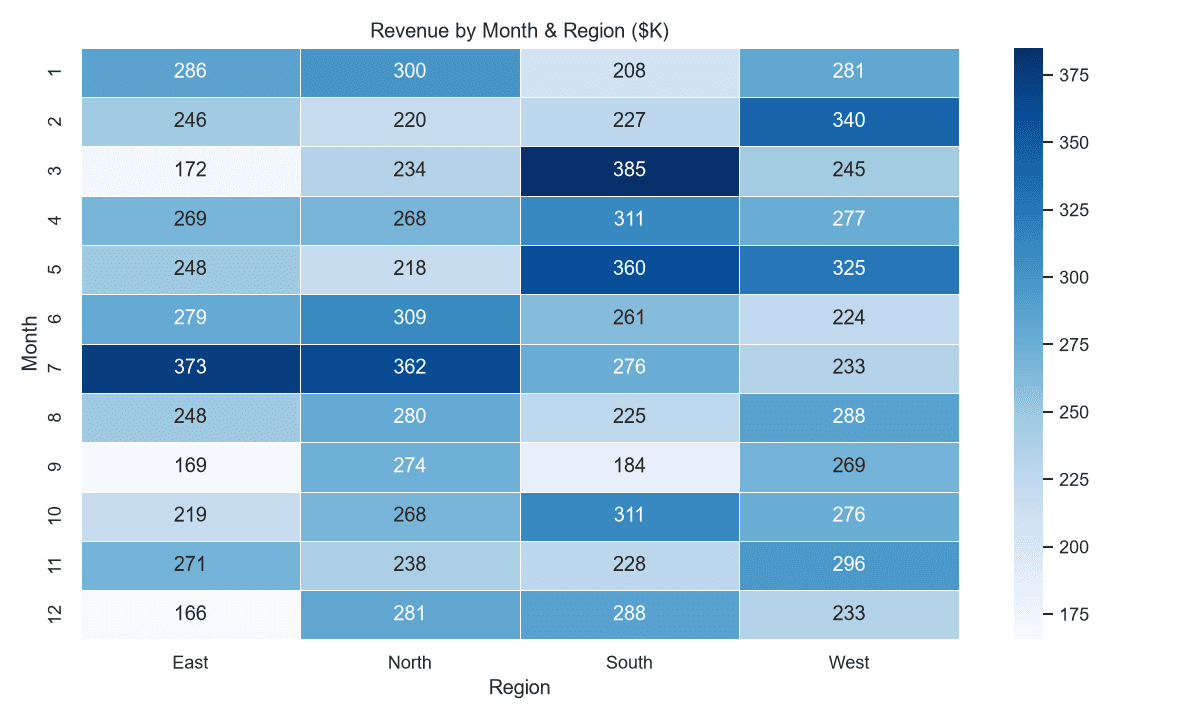
Identified seasonal peaks and troughs — highest revenue in Q4, lowest in Q2
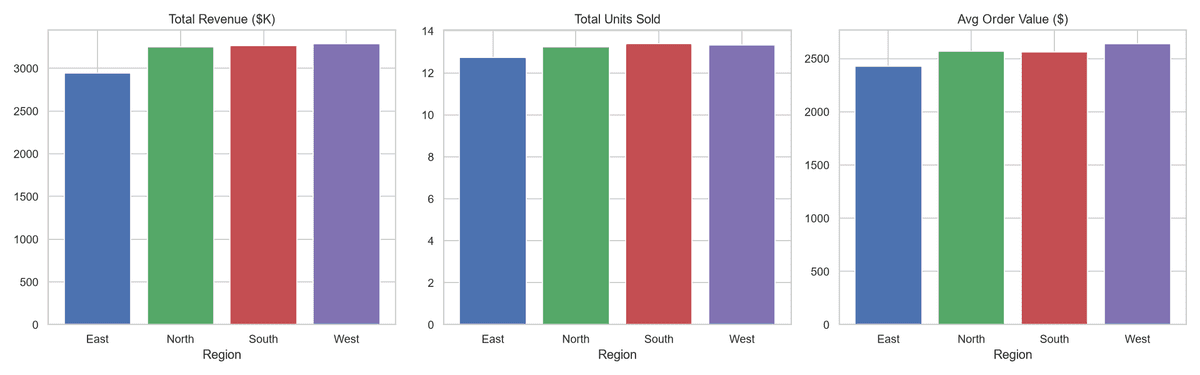
Top region outperformed bottom region by 3.2x in revenue
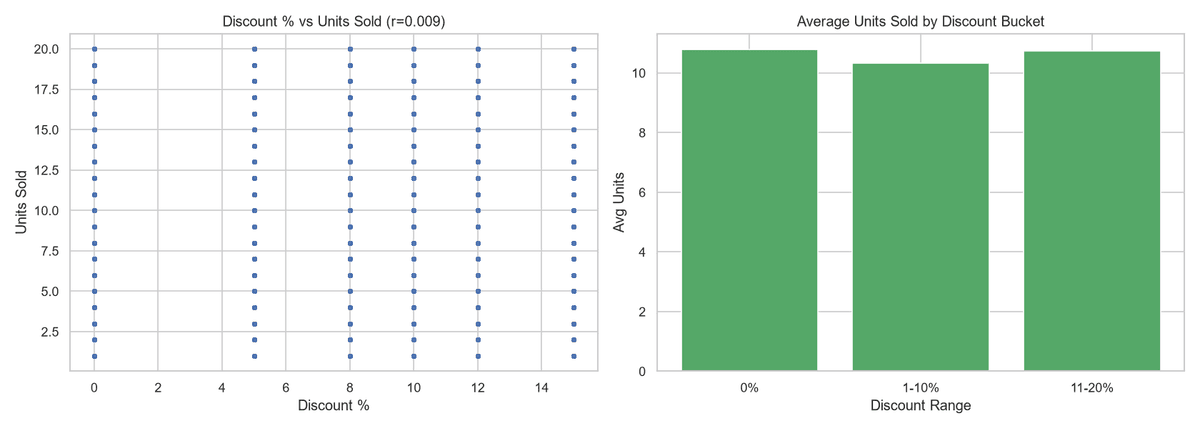
Discount correlation with volume is weak — discounts erode margin without driving sales
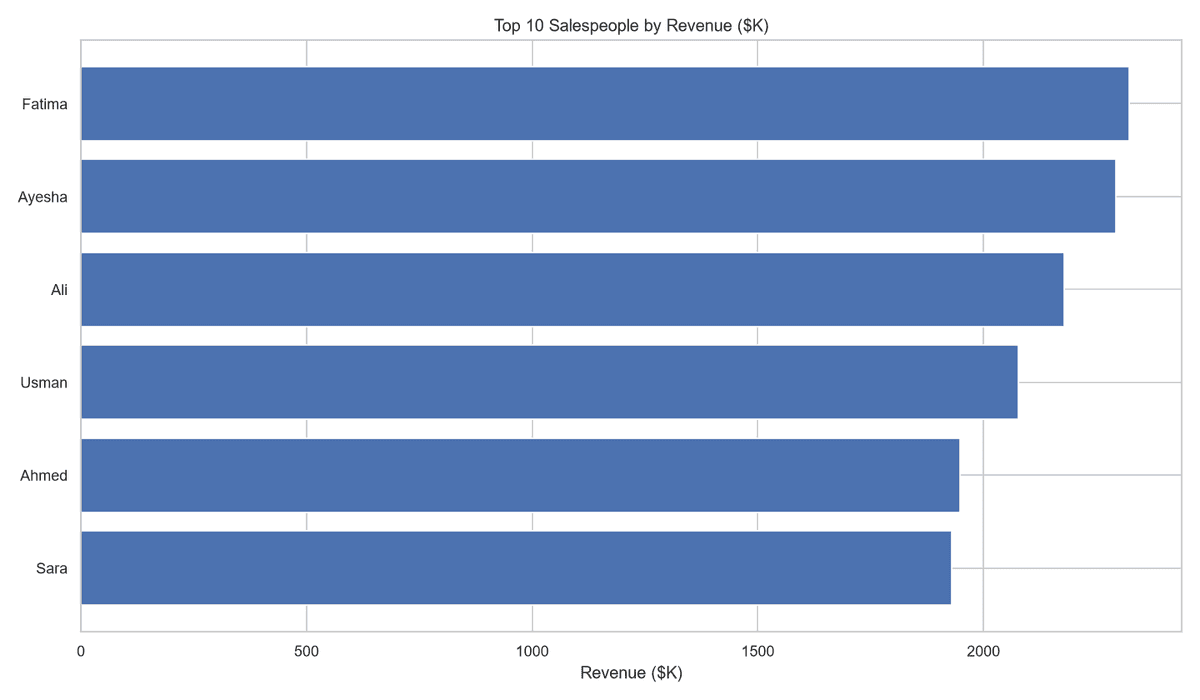
Top salesperson generated 5.6x more revenue than bottom performer
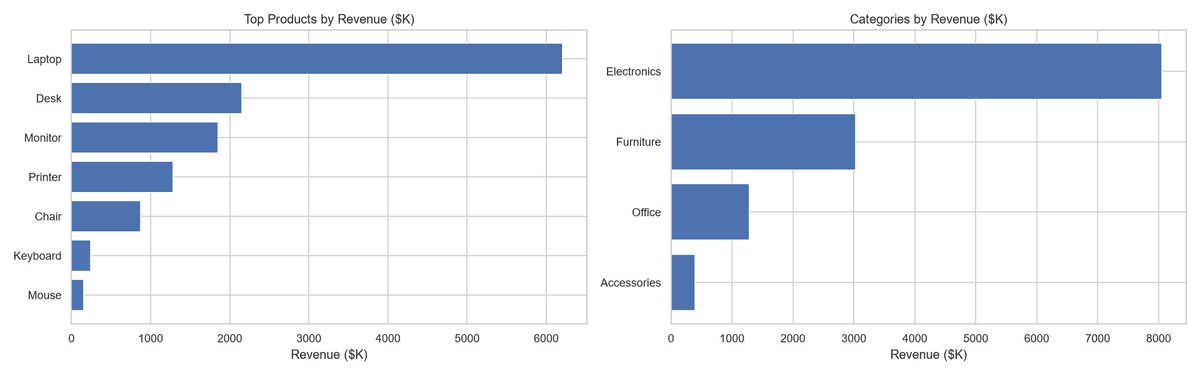
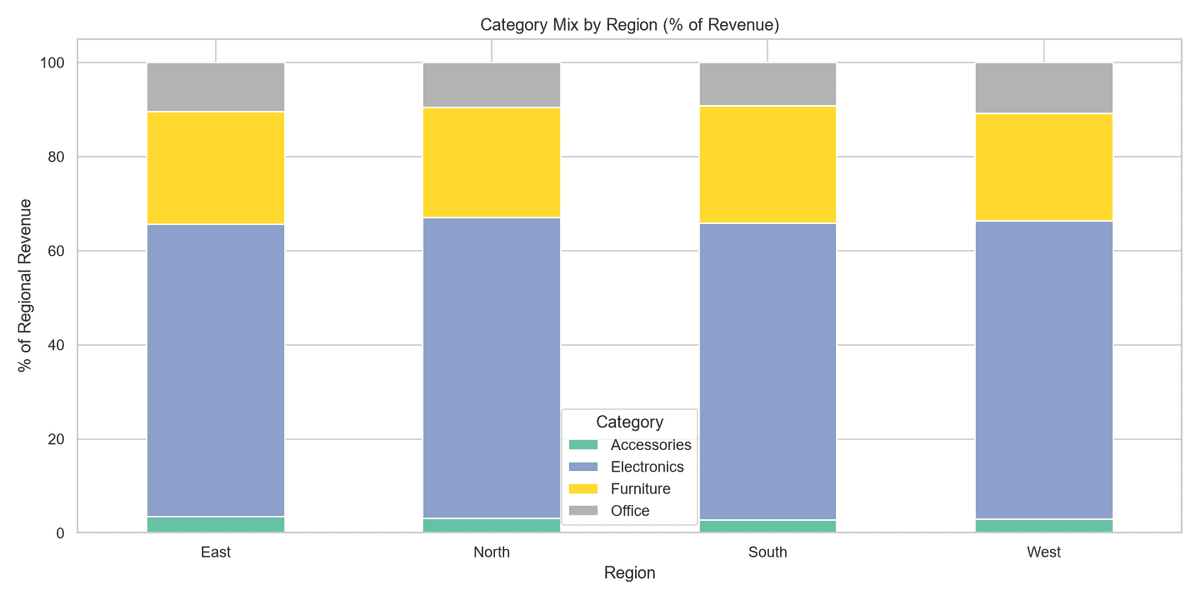
Cross-region analysis revealed category mix varies significantly by region
Business Recommendations
Modeled Estimate (synthetic data)Align inventory and marketing spend with the clear seasonal peaks (Q4) and troughs (Q2).
Re-evaluate the discount strategy — discounts do not drive volume, so protect margins instead.
Adapt the product category mix by region based on regional demand differences.
Share top salesperson techniques with the wider team to lift bottom performers.
Technical Highlights
Python
- ▸Pandas data wrangling
- ▸Matplotlib & Seaborn visualization
- ▸GroupBy aggregations
- ▸Correlation analysis
Analysis
- ▸Time-series decomposition
- ▸Regional performance comparison
- ▸Product category deep-dive
- ▸Discount impact analysis
Visualization
- ▸7 chart types generated
- ▸Heatmaps for cross-analysis
- ▸Monthly & quarterly trends
- ▸Salesperson ranking charts
Dataset
5,000 sales records from 2024, including transaction details, customer demographics, and product categories across 8 regions.
Project Outcome
Modeled Estimate (synthetic data)5,000-record analysis revealing 40% seasonal variance and 3.2x regional performance gaps, enabling targeted marketing and inventory strategies.